
Blog post prepared by Irena Vipavc Brvar (CESSDA/ADP) based on a presentation from Evi Carita Riikonen (ICOS ERIC)
In May’s CoP meeting, Evi Carita Riikonen from ICOS ERIC gave an overview of Key Performance Indicators (KPIs), why they are essential, and how to design them effectively within the context of Research Infrastructures (RIs).
What is a KPI?
A KPI, or Key Performance Indicator, is a measurable value that indicates how well an organization or project is achieving a key objective. In the context of RIs, KPIs help measure the performance of activities, outputs, and outcomes. For example, a common KPI for an RI might be the number of scientific publications that cite its data.
The key here is that KPIs need to be linked to the mission and goals of the RI, and should reflect how well the RI is performing in relation to these objectives.
Why Do We Need KPIs?
KPIs are crucial for several reasons:
- Monitoring Progress: They allow organizations to track how well they are progressing toward their goals.
- Efficient Resource Use: They help monitor whether resources are being used efficiently.
- Demonstrating Performance: KPIs show how well an RI is achieving its objectives, especially in public organizations where there might be moral or legal obligations to report performance to stakeholders and funding bodies.
- Supporting Decision Making: With systematic KPIs, organizations can gather evidence-based data to support decision-making processes.
For publicly funded RIs, KPIs also enhance transparency, fostering trust with external stakeholders and society at large.
Types of Indicators: Performance vs. Impact
It is important to distinguish between performance indicators and impact indicators:
- Performance Indicators measure how well an RI is performing its activities (e.g., how many publications or data sets it generates).
- Impact Indicators measure the real-world outcomes of these activities (e.g., whether the data has been used by policymakers to make informed decisions).
For example, a KPI might measure the number of scientific papers citing RI data, but the impact indicator would measure how these papers influenced decisions or actions that benefit society. Understanding this distinction helps to properly align KPIs with broader impact goals.
How to Identify Areas to Measure?
Every RI has unique goals, missions, and fields of operation, so identifying KPIs should be tailored to each RI’s specific context. Here are steps to guide the process:
- Align with Mission and Strategy: Start by identifying the RI’s strategic goals. For example, if the goal is to facilitate scientific progress, then the KPI might focus on the use of RI data in scientific research.
- Define Clear Metrics: KPIs should be quantifiable. For instance, you might track the number of publications or citations from RI data. Clear definitions are essential to ensure consistency and avoid ambiguity.
- Target Audience: Consider who the KPIs are intended for. Are they for internal monitoring, for stakeholders like funders, or for reporting to the public? This will determine the level of detail and the type of KPIs to focus on.
Designing Effective KPIs
To design a useful KPI, there are several factors to consider (RACER criteria):
- Relevant: KPIs must be directly linked to the specific objectives of the RI within a defined timeframe. This ensures that the indicators are meaningful and contribute to achieving the broader goals.
- Accepted by the RIs and stakeholders: For KPIs to be effective, they must be widely accepted by all levels of the RI and its stakeholders. If key parties do not support or understand the KPIs, implementation and usage will be limited, reducing their overall impact.
- Credible: KPIs need to be credible, especially when interpreted by non-experts. They should be unambiguous, easy to understand, and offer clear insights that can be interpreted correctly by people without specialized knowledge.
- Easy to monitor: Effective KPIs should be simple and low-cost to monitor. Data collection processes should be straightforward and not overly time-consuming or expensive, as this will make the monitoring process more sustainable in the long term.
- Robust: KPIs should be resistant to manipulation and provide consistent results over time. This means that the metrics should be reliable, offering an accurate reflection of performance that is difficult to skew or distort.
The Role of Fact Sheets in KPI Design
A fact sheet is a document that outlines how a KPI is measured, the methodology used, and the data sources involved. It clarifies the definition of terms, the rationale behind the KPI, and who is responsible for collecting and reporting the data.
Here’s a simplified example for an RI KPI:
- KPI Name: Use of RI Data in Scientific Publications
- Strategic Link: This ties into the RI’s goal of facilitating scientific progress.
- Objective: To measure the extent to which RI data is being used in scientific publications.
- Metrics: Number of publications citing RI data, number of citations.
- Data Sources: Research repositories, citation databases.
- Assessment Criteria: Clarity, relevance, acceptability, ease of data collection, and impact measurement.
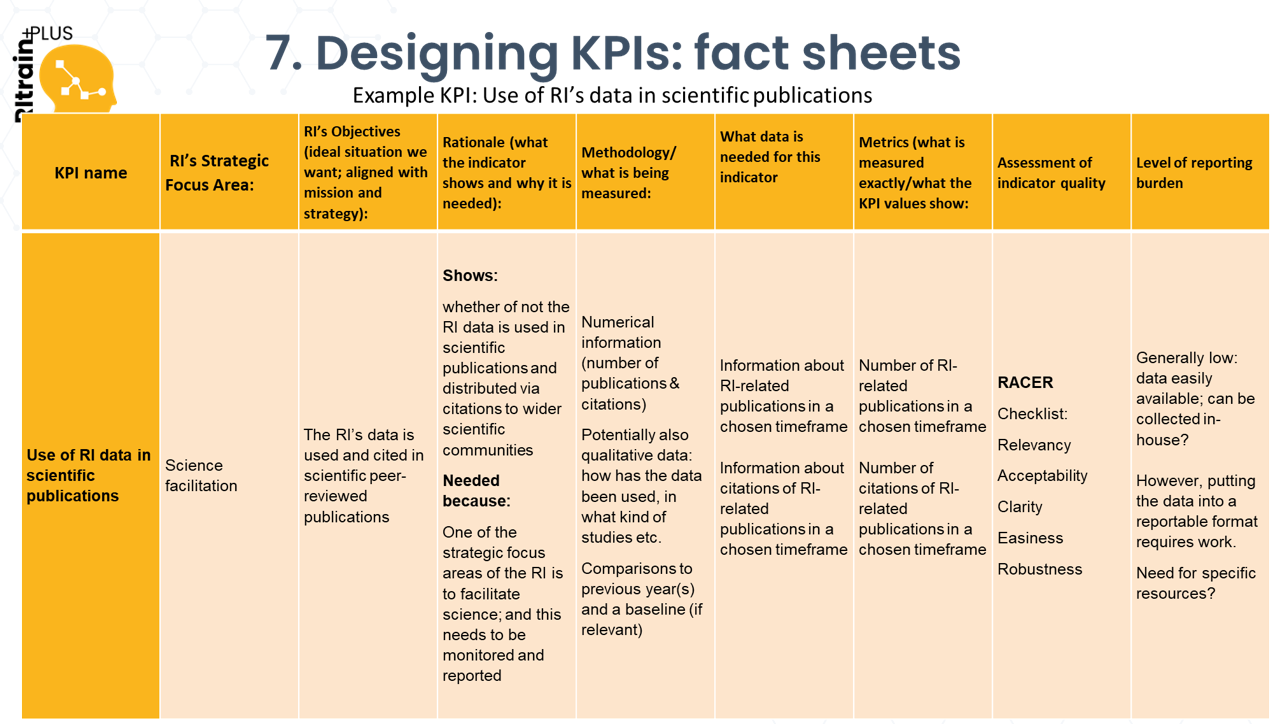
Source: Presentation slide from Evi Carita Riikonen
Fact sheets are useful not only for transparency but also for onboarding new staff or stakeholders and ensuring consistency over time.
Monitoring KPIs Across the Research Infrastructure Lifecycle
As RIs evolve, so too should their KPIs. Early in the lifecycle, KPIs might focus on readiness and infrastructure development, while later KPIs might focus on operational performance. The frequency of measurement may also vary: some KPIs may be evaluated annually, while others may be assessed over longer intervals.
The Importance of Evaluation
Finally, it’s important to periodically review and evaluate KPIs to ensure they remain relevant. An RI’s goals and context can shift over time, and KPIs should be flexible enough to adapt. Regular evaluation of KPIs helps ensure that the performance measures are still aligned with the organization’s evolving mission and objectives.
Conclusion
Designing effective KPIs for RIs is a critical process that ensures accountability, transparency, and continuous improvement. By carefully aligning KPIs with the RI’s mission, defining clear metrics, and periodically evaluating their relevance, we can ensure that RIs can demonstrate their impact and progress to stakeholders and society. Remember, KPIs are not just about collecting data—they are about telling the story of an RI’s contribution to science and society.
Resources: The ERIC Forum Toolkit
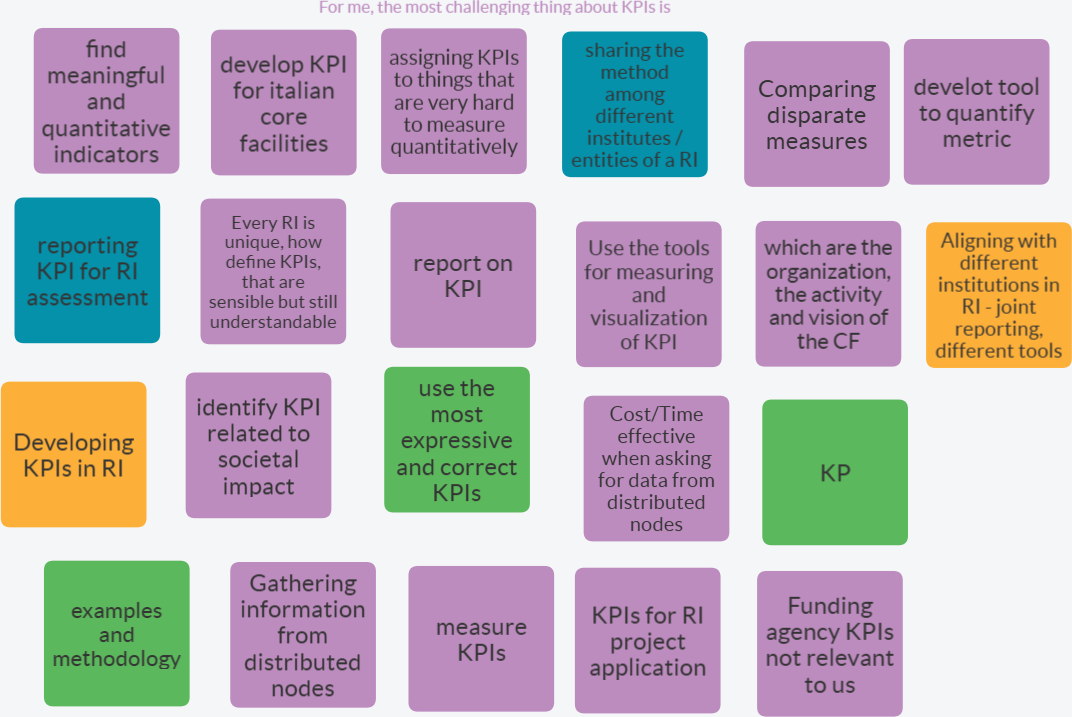
Source: Flinga board used at the meeting – Most challenging thing about KPIs reported by participants
_________________________________________
If you missed the session, you can watch it by joining the RITrainPlus Facebook CoP.
You can also access video and presentation from the event.
Flinga board notes.
Stay tuned for more insights and discussions as we continue to explore the fascinating world of research infrastructures.
_________________________________________
About RItrainPlus CoPThe RItrainPlus CoP provides a forum for discussion about relevant issues and opportunities for knowledge and best practices sharing through a peer learning approach that would support research infrastructures (RIs) and core facilities (CFs) in their specific managerial and operational challenges. The CoP offers new community meetings every two months, and by signing up, you will be able to access the meeting recordings and materials. This is a great opportunity to learn from experienced professionals and stay up-to-date with the latest best practices in the research infrastructure landscape. Sign up to the RITrainPlus Facebook CoP, and follow RItrainPlus on LinkedIn and X to stay tuned about upcoming events!